CloudWatch
A managed service that can be used to collect and analyze various cloud resource and application metrics and logs
- CloudWatch Logs supports a “destination” in a central account. You can configure other accounts to stream their logs to that destination, unifying them.
- This approach means all logs from multiple accounts end up in a single place for analysis
- diagram
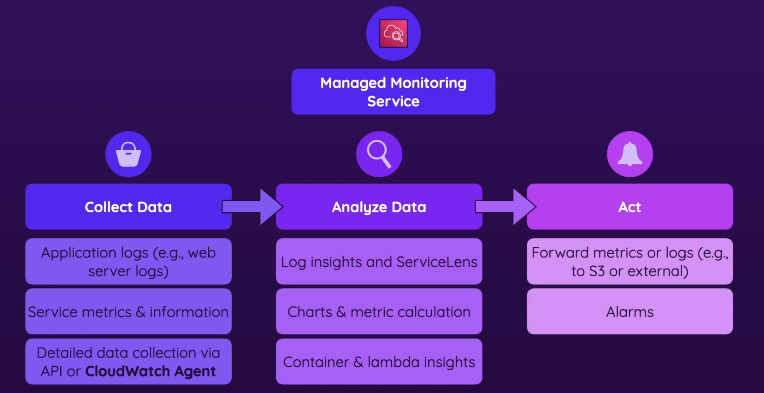
- Collect data
- You can basically collect any data you want, and a lot of data is collected out of the box automatically (or at least when you turn on logging when starting to use certain services)
- application logs
- some services automatically writes logs to CloudWatch, like Lambda
- You can interact with CloudWatch from in our code and write your log files, or use extra tools for doing that
- Service metrics & information
- CPU utilization, amount if KB stored in an S3 bucket
- Most services integrate with cloudWatch and publish metrics & info to cloudWatch
- Cloud Agent
- Use you have something that’s not logged out of the box and you can’t enable it by default
- Sends direct API calls to CloudWatch to log any arbitrary data or additional metrics
- very useful
- you can even install on top of EC2 instances to collect additional data
- Analyze data
- Log insights & ServiceLens
- Calculate metrics & create chars
- create dashboards
- overview of how ur services are operating
- Enhanced capabilities for Containers and lambdas
- allows u to dive even deeper
- Act
- Allows you to act on certain problems, by either forwarding metrics/logs to other services (like a 3rd party provider)
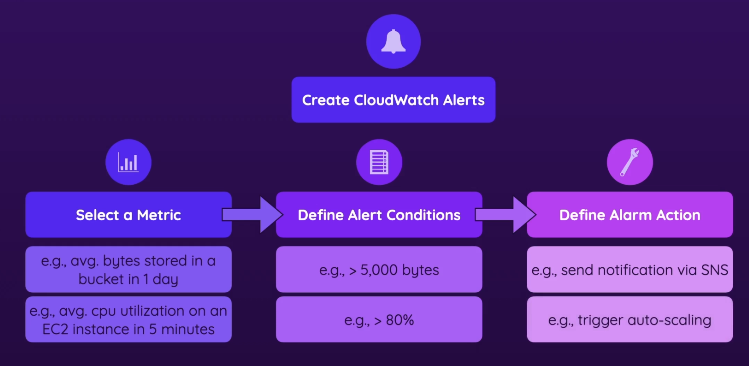
- Set alarms
- get notified when a certain metric goes outside of the expected
- The Dashboard
- Allows you to get a quick overview of key metrics & trends
CloudWatch alerts